What is AutoLigand?
AutoLigand was developed as a tool to identify ligand binding sites on or within receptor proteins. AutoLigand uses an effective method to scan rapidly for high affinity binding pockets and reports the optimal volume, shape, and best atom types for the identified ligand binding sites. The code can also be used as a rational drug desgin tool by overlaying drug candidates on the generated fill volumes and modifying the drug to make the best use of the mapped affinity. AutoLigand is included with the AutoDockTools package.
Basic premise
Not all elements of a natural ligand have the same binding affinity; some elements of the ligand bind tightly while others provide lower affinity linking structure. AutoLigand mimics this behavior by generating a contiguous fill volume that attains the best total affinity per volume.
How AutoLigand works
The user first creates affinity maps using AutoGrid. The maps are created by scanning each atom type (carbon, oxygen, and hydrogen) through the grid and recording its affinity at that point (note that the affinity values for all hydrogen bond acceptors are similar so only oxygens are used). AutoLigand first performs a simple flood-fill of the user’s input volume starting at each point in the grid and saves the best 10 non-overlapping fills. Next, AutoLigand lets the fill volumes migrate (like an amoeba) to a shape and location with best binding energy and lowest volume. To avoid falling into a local minima, rays are cast out to 10 Angstroms away from the fill volume to look for better affinity (like pseudopods from an amoeba). The migration is complete when no points can be moved to produce a better solution.
Finding unknown ligand sites in a receptor with AutoLigand
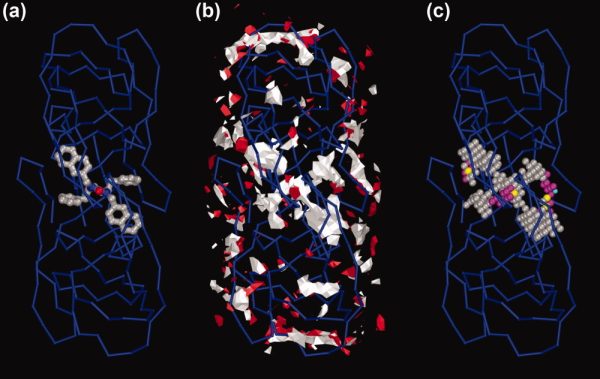
To find unknown lignad sites, AutoLigand is run with a series of fill volume sizes and plotted as Total Energy/Volume vs. Volume. The sharp peak in figure 5 is the optimal size of the fill volume and was shown to fill the active site in the HIV protease (PDB: 1hps). The peak is due to the change in total energy of the fill volume as larger volumes are used. As more points are added, the affinity improves until an optimal fill is reached, then as more points are added, the volume is increased with less affinity points which reduces the overall affinity. The different colors in the plot show different regions of fill overlap. When small volumes are used, there are many posible binding sites. But, as larger fill volumes are used, the results collapse to a single best fill region (which is normally the active site). The best affinity of the active site of the HIV protease is X-shaped (see figure 1). The smaller fills in the black set (volumes 100 to 200) can only fill one of the legs of the X. As larger fills are used (cyan set, volumes 300 to 500), a second leg of the X is filled. Finally, the green set fills all four legs of the X-shape until an optimal volume of 1000 is reached.
The AutoLigand paper can be accessed here:
Harris, R., Olson, A., J., Goodsell, D., S. Automated prediction of ligand-binding sites in proteins — 2007 Proteins: Structure, Function and Bioinformatics.
The AutoLigand Tutorial can be downloaded here: AutoLigand tutorial (8545 downloads )